

The Geography of COVID Business Start-ups
A brief, preliminary exploration

Introduction
Prior to the COVID Pandemic, new business starts in the United States stagnated. As a share of total population, the last decade an a half has seen a modest decline in new business formation. But, as the figure below illustrates, the COVID Pandemic resulted in a sharp increase in new business formation. In the 36 months since the Pandemic, Americans are continuing to start new businesses at a rate that is a third higher than the 2006-2019 average.

This shock is clearly linked to the COVID pandemic. John Haltiwanger’s work on this reports that this surge in business starts was concentrated in non-store retail, personal services, professional, scientific and technical services, administrative and support services, truck transportation and accommodation and food services (see page 19-20). He concludes that this distribution of new businesses was consistent with restructuring of existing industries, because these industries experienced the most COVID related disruption.
This short Brookings piece provides a summary of trecent data, why new business formation is important and what policies might sustain these businesses in the early years. These are interesting questions, to which this essay asks “what might have contributed to regional variation in entrepreneurship during this period?”
Our approach begins by adopting Ed Glaeser’s economic approach to cities. He argues that there are three basic explanations for the size change in cities. The first are agglomerations, or productivity of a firm that cannot be explained by their capital investment (equipment) and observed talent of their workforce. The second is quality of life (some cluster of amenities). The third and final one is the responsiveness of housing supply to population growth.
Our focus is the short run new business starts (from a base of 2019 through 2021). Thus, we’ll focus primarily on quality of life and agglomerations, using new business starts as our proxy for entrepreneurship. To link entrepreneurship to quality of life and agglomerations, we look to recent work by Tessa Conroy and Phillip Watson on the oversupply of education.
Conroy and Watson (2023) estimate the over/undersupply of college graduates in a county, and model this alongside natural amenities to test the growth of new business starts. This is an interesting insight, since so much of the literature on entrepreneurship focuses on educational attainment as a key determinant of entrepreneurial success. See Vijverberg, 2008 for a review, and Bunten, Weiler, Thomson and Zahran (2015) for the specific measure of share of adults with a college degree as a determinant of entrepreneurship.
Conroy and Watson calculate the expected level of education given the occupational mix of a county, then subtract that value from the observed level of educational attainment. The resulting over/undersupply of college graduates is then included in a statistical model that includes other contributors of entrepreneurship, including natural amenities. They report the importance of both natural amenities and educational over/undersupply in new business starts in the decade prior to COVID.
Our Approach
We focus on the geographic variation in new business starts from 2019-2021. This three year period captures the pre-COVID baseline through the most recently available data. We employ quality of life, agglomerations and over/undersupply of college graduates in each county to explain that regional variation.
We begin with the familiar quality of life estimate, which I have explained previously in this venue. Here we use 2019 estimates, employing data from the 2019 American Community Survey. We produce two estimates. The first is an hedonic estimate of home values for each county, then an hedonic estimate of wages. The hedonic model creates statistically identical homes or worker in each county. Each equation also calculates the level of ‘unexplained’ home value or wages in each county.
This is the traditional Rosen-Roback model of quality of life, which we describe in detail here. In short, households will pay more for a home, and accept a modestly lower wage to live in the community they prefer. So, subtracting the level of unexplained wages from unexplained home values provides us a county level estimate of Quality of Life.
That appears in the map below.

The second step is to estimate agglomerations. This is done by estimating a human capital augmented Cobb-Douglas production function for each US county. This is the most common regional growth model. In this model, output per worker is a function of local technology, capital per worker and human capital. To populate the equation with data, we have county level GDP as output, the non-labor share of income as capital and share of adults with a BA as our human capital measure.
The share of GDP per worker that is not explained by this model is our proxy of agglomerations, or unexplained productivity within the firms in a county. Here, the darker, the more unexplained productivity in a county, the lighter, the less unexplained productivity in a county.

The third step is to estimate the over or under supply of college graduates at the county level. To do this, we depart from the Conroy and Watson method, using instead a statistical model where the share of college graduates is regressed upon industry shares and demographic data in each county.
In this approach, a surplus of college graduates will appear as a positive value of the error term, while a shortage of college graduates appear as a negative value in the error term (unexplained variation). In this graphic, we have the oversupply of bachelor’s degree holders as darker values, and undersupply in lighter colors.

Altogether, this results in our having produced three separate data points for each U.S. county: Quality of Life, Agglomerations and Over/Undersupply of College graduates.
This approach differs from earlier work on entrepreneurship across regions in several key ways. First, we make no assumptions regarding amenity preferences. The Rosen-Roback approach need not be that restrictive, and our work has relaxed that assumption. We’ll permit markets to reveal to us valuations from buyers and sellers of homes and employers and employees in labor markets.
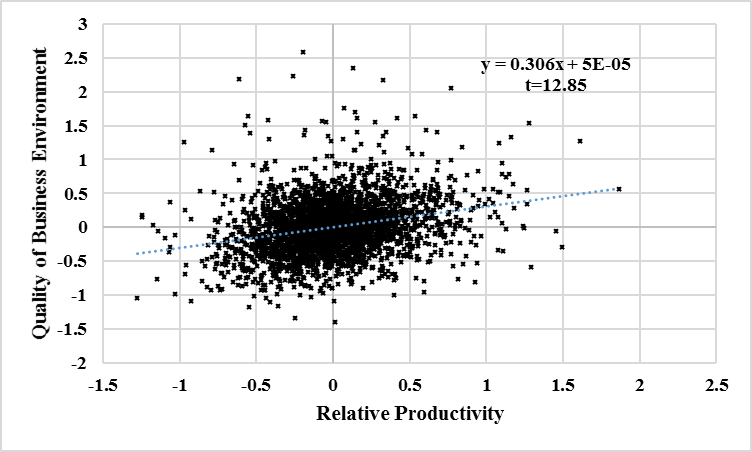
Second, we use actual observed variation in productivity to measure agglomerations. Other approaches, such as using population density are again, more restrictive. We note that the Quality of Business Environment measure introduced by David Albouy and our measurement of agglomerations are strongly correlated. Teasing out these two measures will be something we spend considerable time on in the coming months.
Finally, we develop a statistical (stochastic) model of the observed over/undersupply of college graduates by county, receiving a county measure of that variable. Altogether, we can then test whether these three variables explain the geographic variation in new business starts (per 1000 residents) from 2019 through 2021.
The following table reports that very simple regression on 3,062 counties for which we have data (out of a total of 3,144 county sized units in 2019). In this model, agglomerations, quality of life and BA over/undersupply all are positively correlated with new business starts per 1,000 residents.
The interaction between agglomerations/BA over-under supply and the Quality of Life/BA over-under supply are not statistically significant. However, the interactions between agglomerations and quality of life are negative, suggesting that the combination of the two reduced new business starts.

As a cautionary note however, this does not necessary imply negative effects to economic activity. If the Haltiwanger analysis is correct (and I believe it is), the spike in new business starts after COVID had its genesis in the dissolution of existing businesses during the pandemic. Though earlier studies (e.g. Gabriel and Rosenthal, 2004) report that firms and households likely are not attracted to the same places, we have evidence of growing correlation over time (again, part of our ongoing research we’ll write about later). And, in the wake of COVID, firms in high agglomerations and high quality of life places may simply have survived the pandemic better than others. This would mean they’d be less likely to see large firm growth afterwards.
The map of new business starts is dominated by outliers in the Jackson Hole, WY region. But, a few points emerge. While there is not a great deal of apparent correlation between these maps, a few places do warrant comment.

Compare the eastern range of the Rockies across the over/under supply of BA graduates and new business starts. Also, note the Acela Corridor (DC to NYC), Utah, Florida and Idaho in both maps. Clearly something is going on here, which we are trying to understand.

Conclusion
This is a very preliminary presentation of the role quality of life, agglomerations and the over/under supply of college educated adults had on new business starts over the COVID Pandemic.
It does appear that all these factors play a role in the geographic variation of new business starts. Initial evidence is that quality of life is the stronger of the three, the model presented here doesn’t do a great job in accounting for the possibility that quality of life and agglomerations influence the over/undersupply of college graduates. We will tackle that in later research, but what is clear is that if you wish to influence economic activity in your county, there are policy levers at hand. Education quality and quantity is probably the key variable tying all these phenomenon together.